
What is a data operations center?
Learn MoreWhat is a data operations center?
Learn More

Your Data Operations Center AI-Powered, Always On
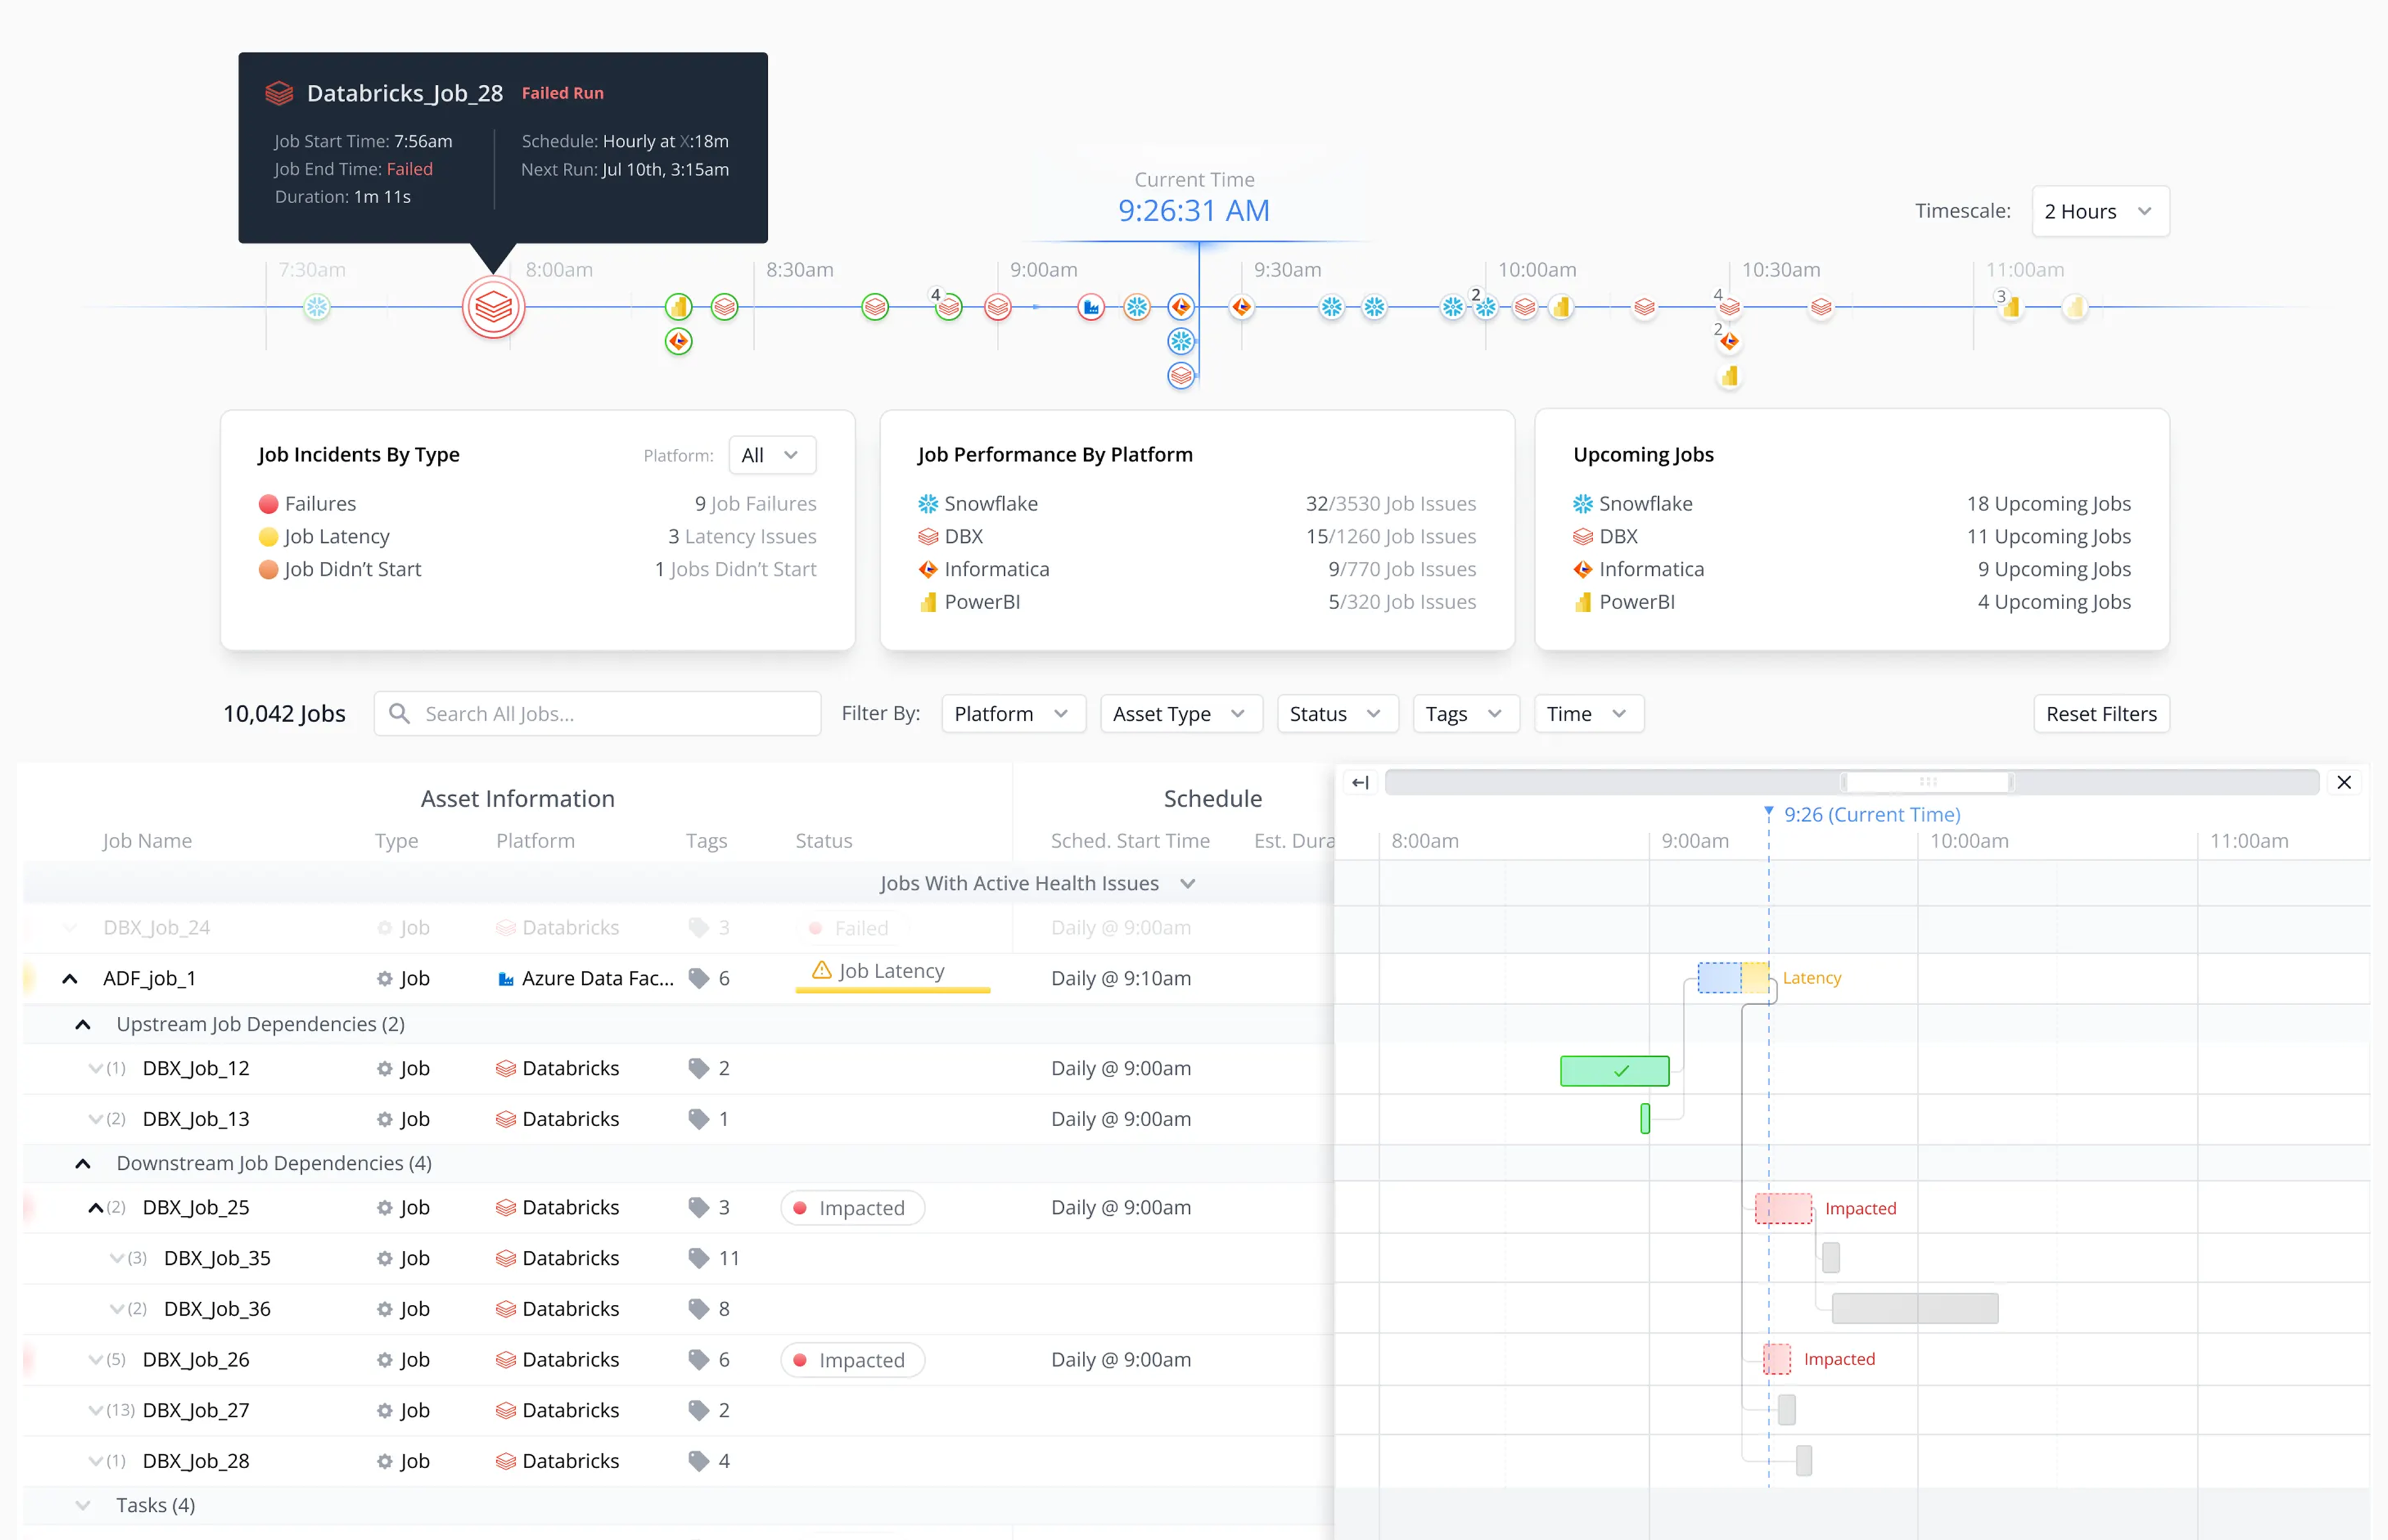
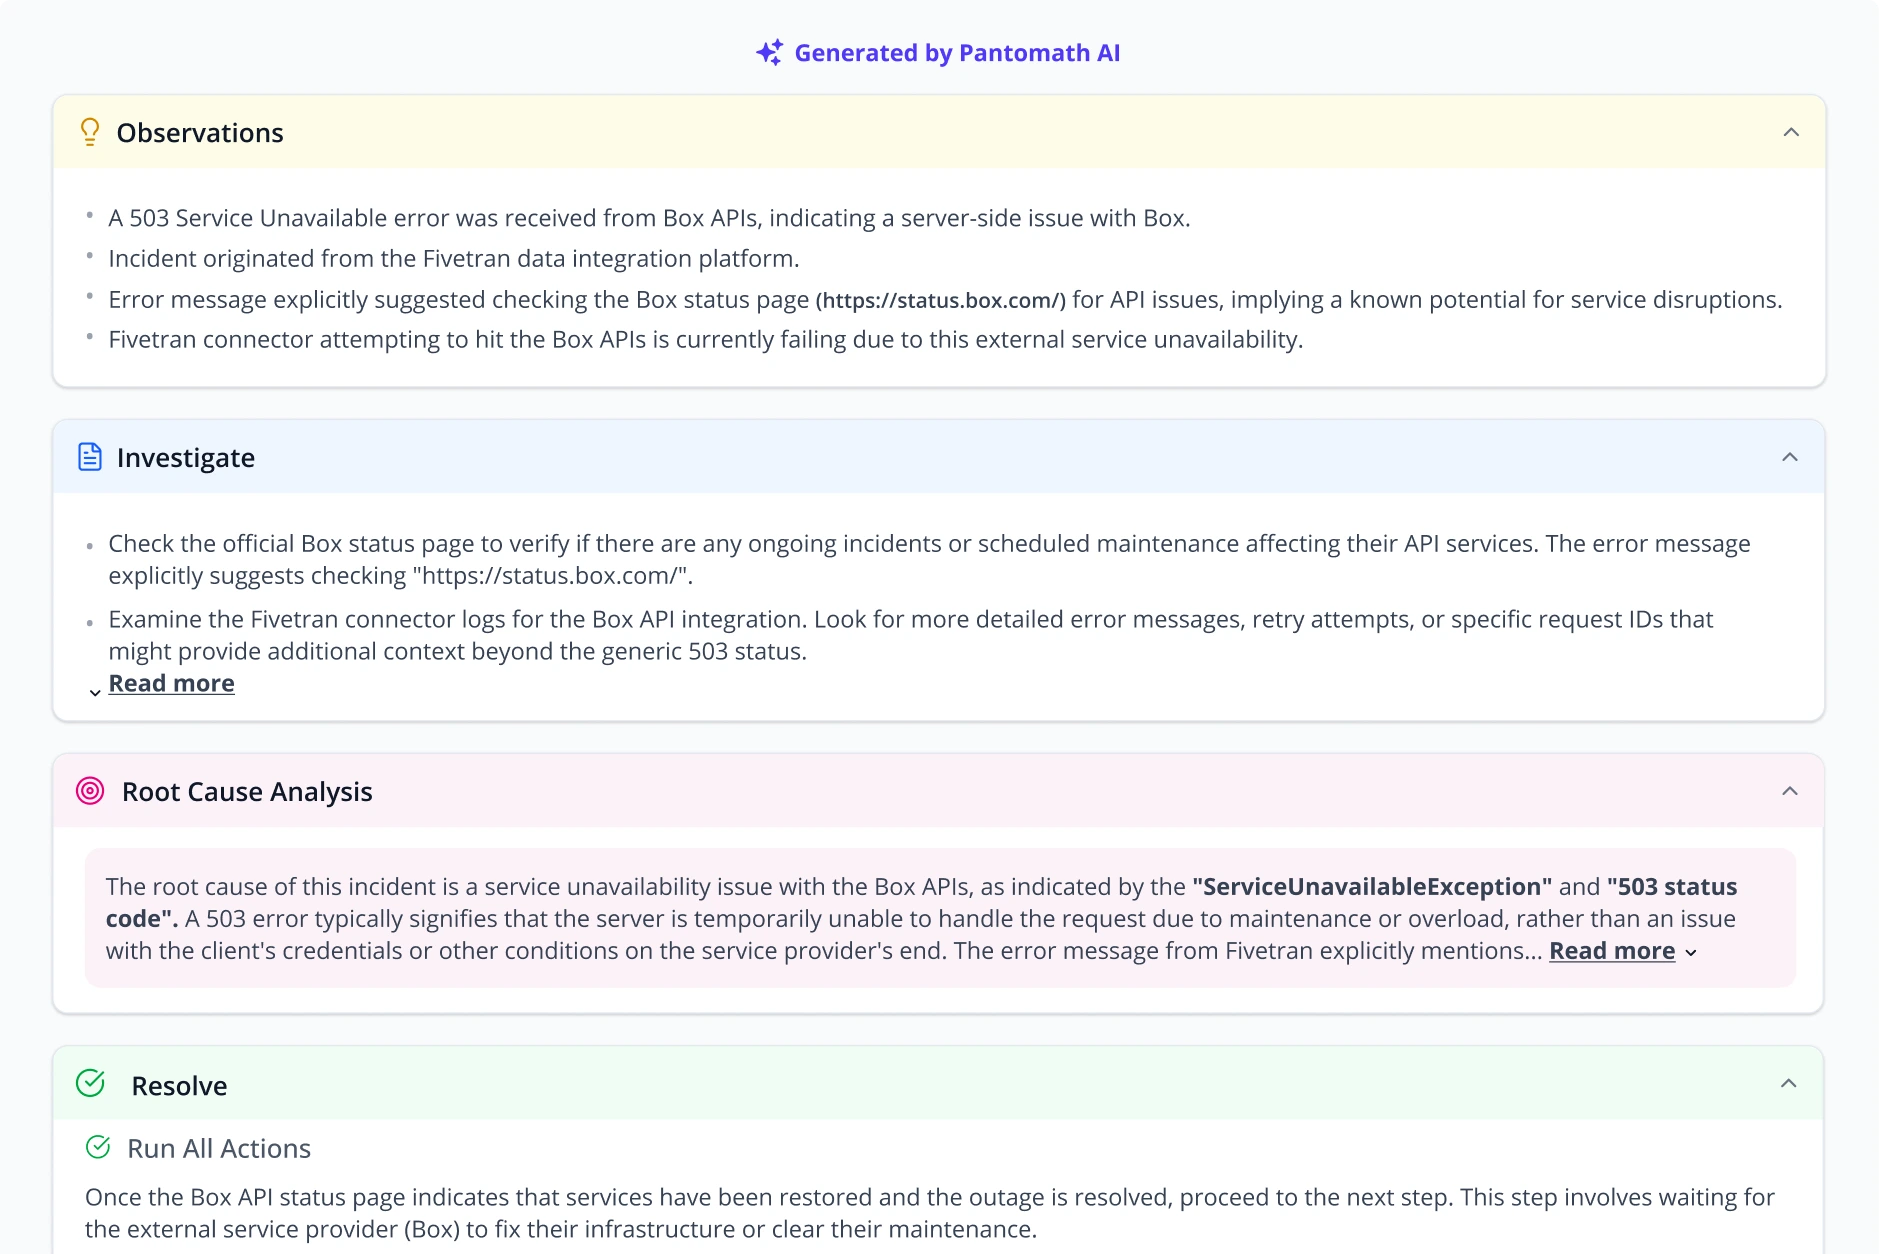
Full self resolution of issues across the data stack


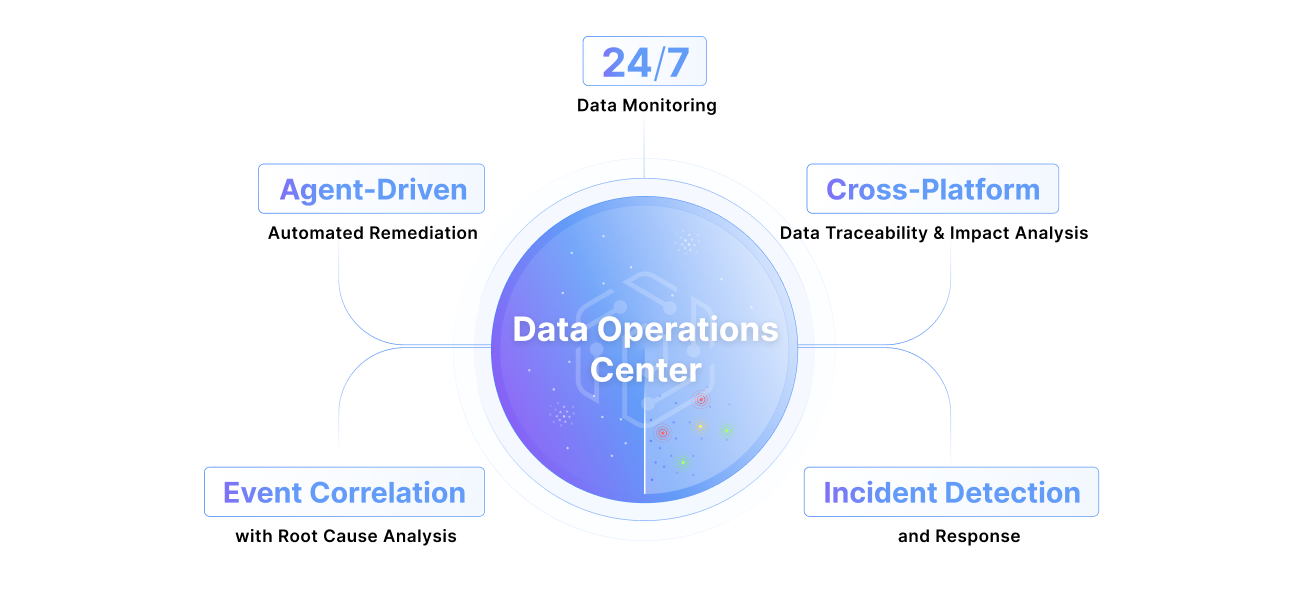
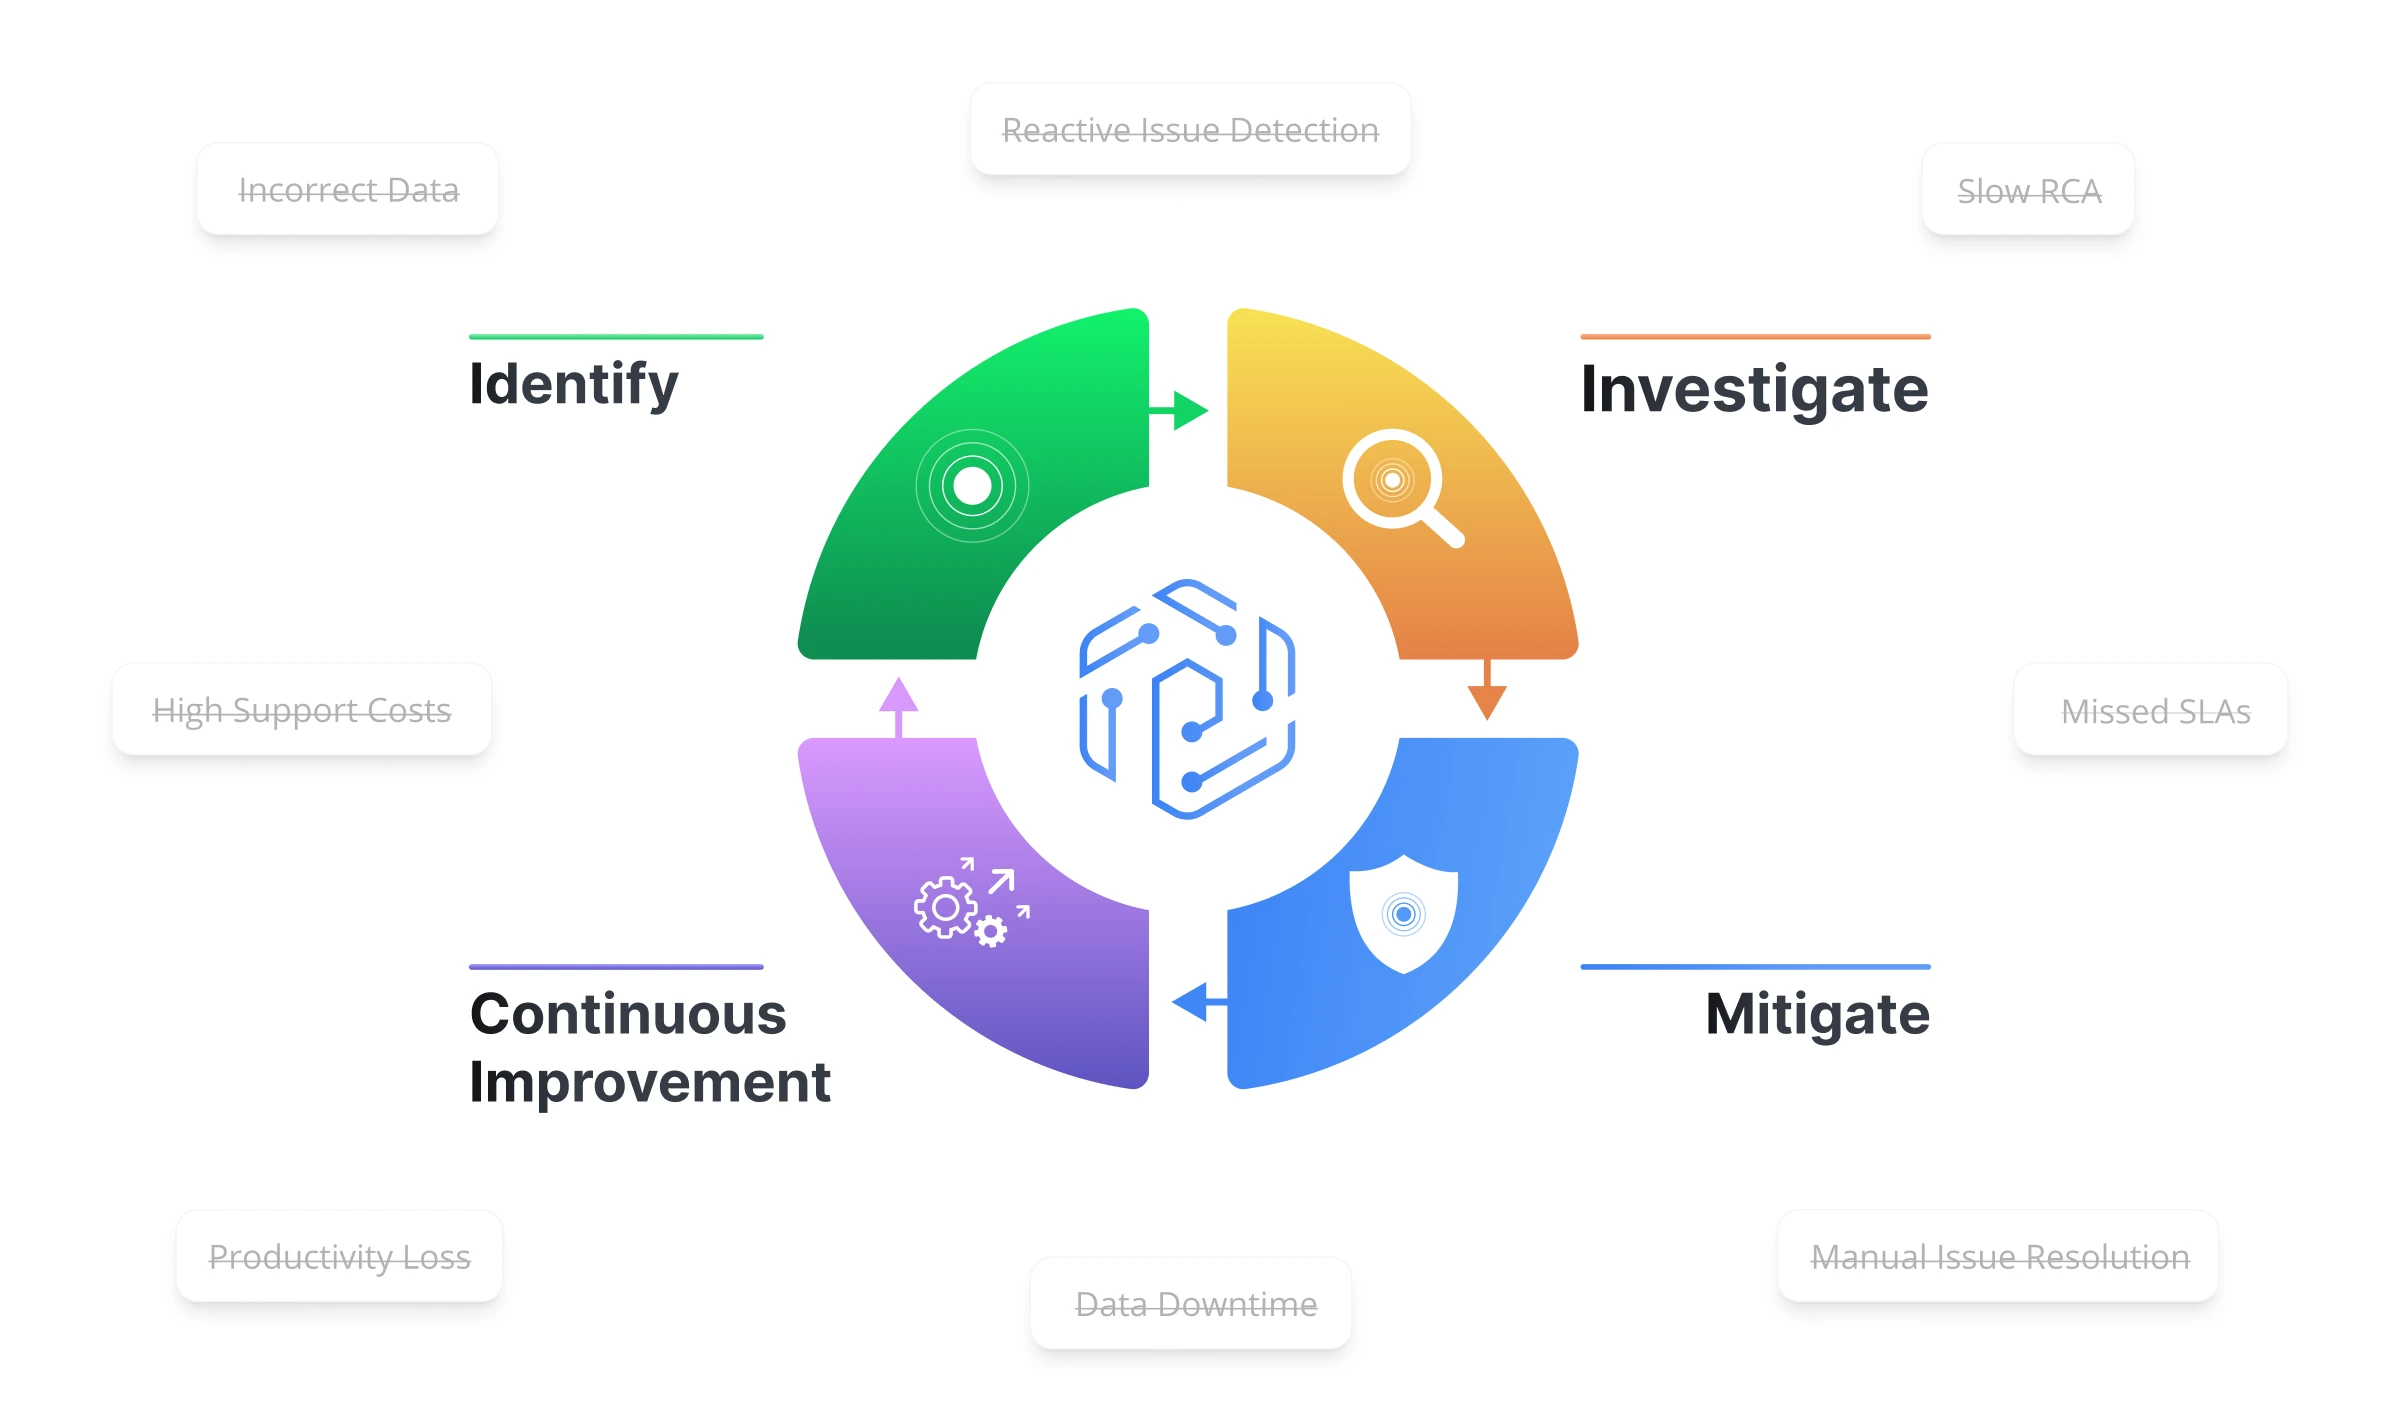
What is a Data Operations Center?
What is a
Data Operations Center?
A centralized hub that monitors and manages an organization’s data analytics ecosystem.
The data equivalent of a Security Operations Center (SOC) or Network Operations Center (NOC), this unit includes data reliability engineers and AI agents tasked with addressing and remediating data reliability and integrity issues.
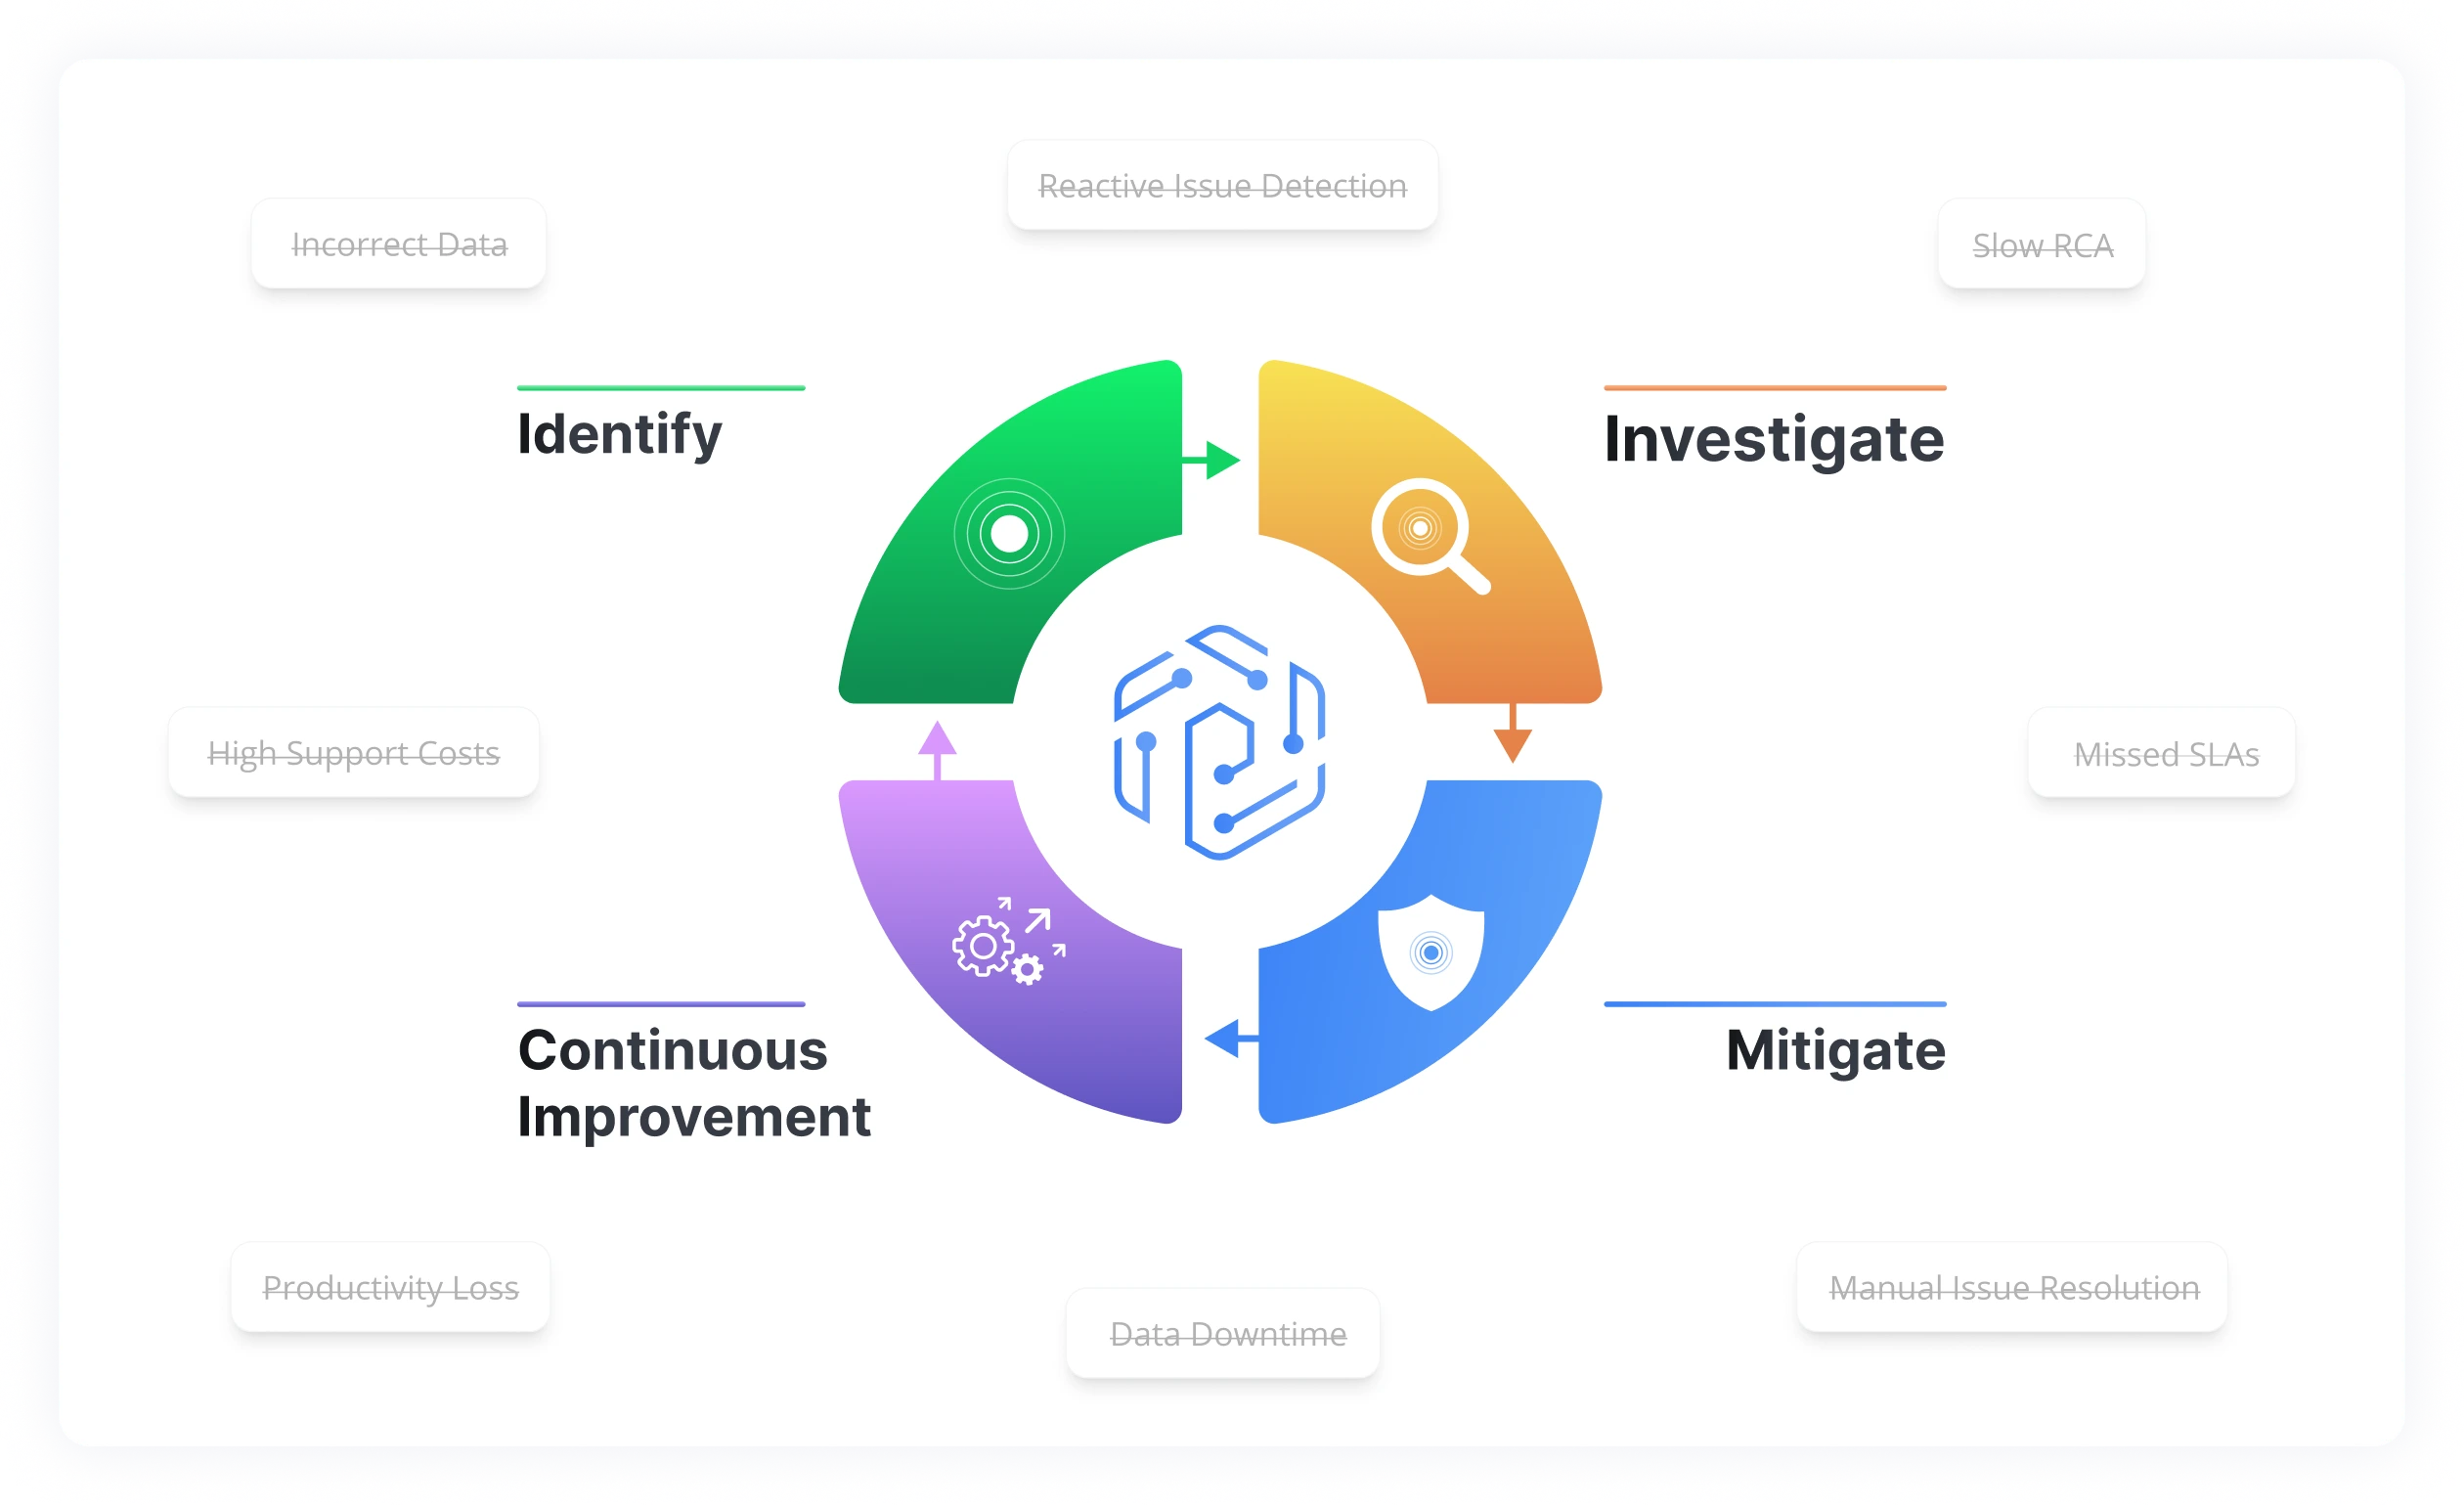
Transform your Data Operations Model with AI-Powered Automation
.svg)
.svg)
.svg)
.svg)
.svg)
It’s Time to Simplify, Automate, and Trust Your Data
Latest News & Press Releases
.png)
As part of this investment, Pantomath is deepening its integration with the Snowflake AI Data Cloud. Learn more...
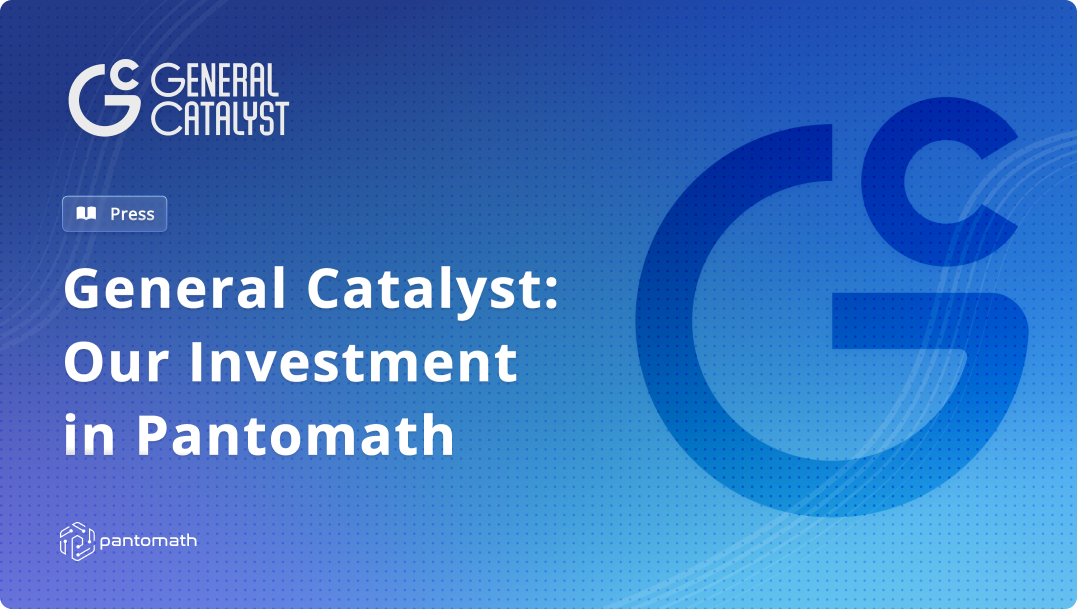
Enterprises don't need yet another tool for humans to do this work. They need the work done. That's why we're leading Pantomath's $30 million Series B round.
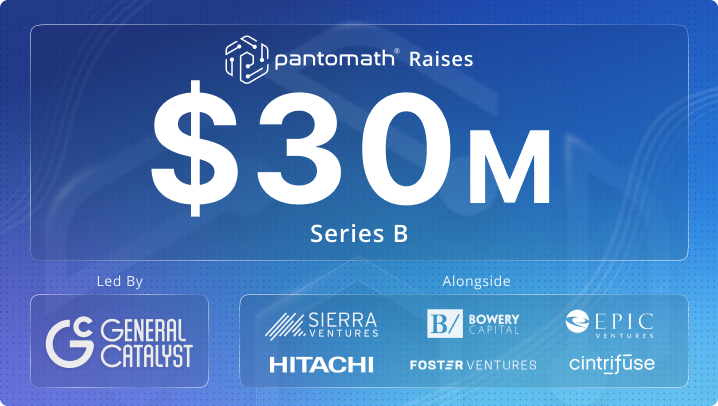
Funding accelerates the company’s mission to eliminate manual data operations by combining real-time monitoring, traceability and agentic AI to boost enterprise data reliability at scale.